Photos | Defcon 17 Graph Analysis

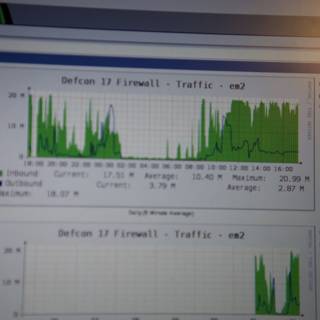
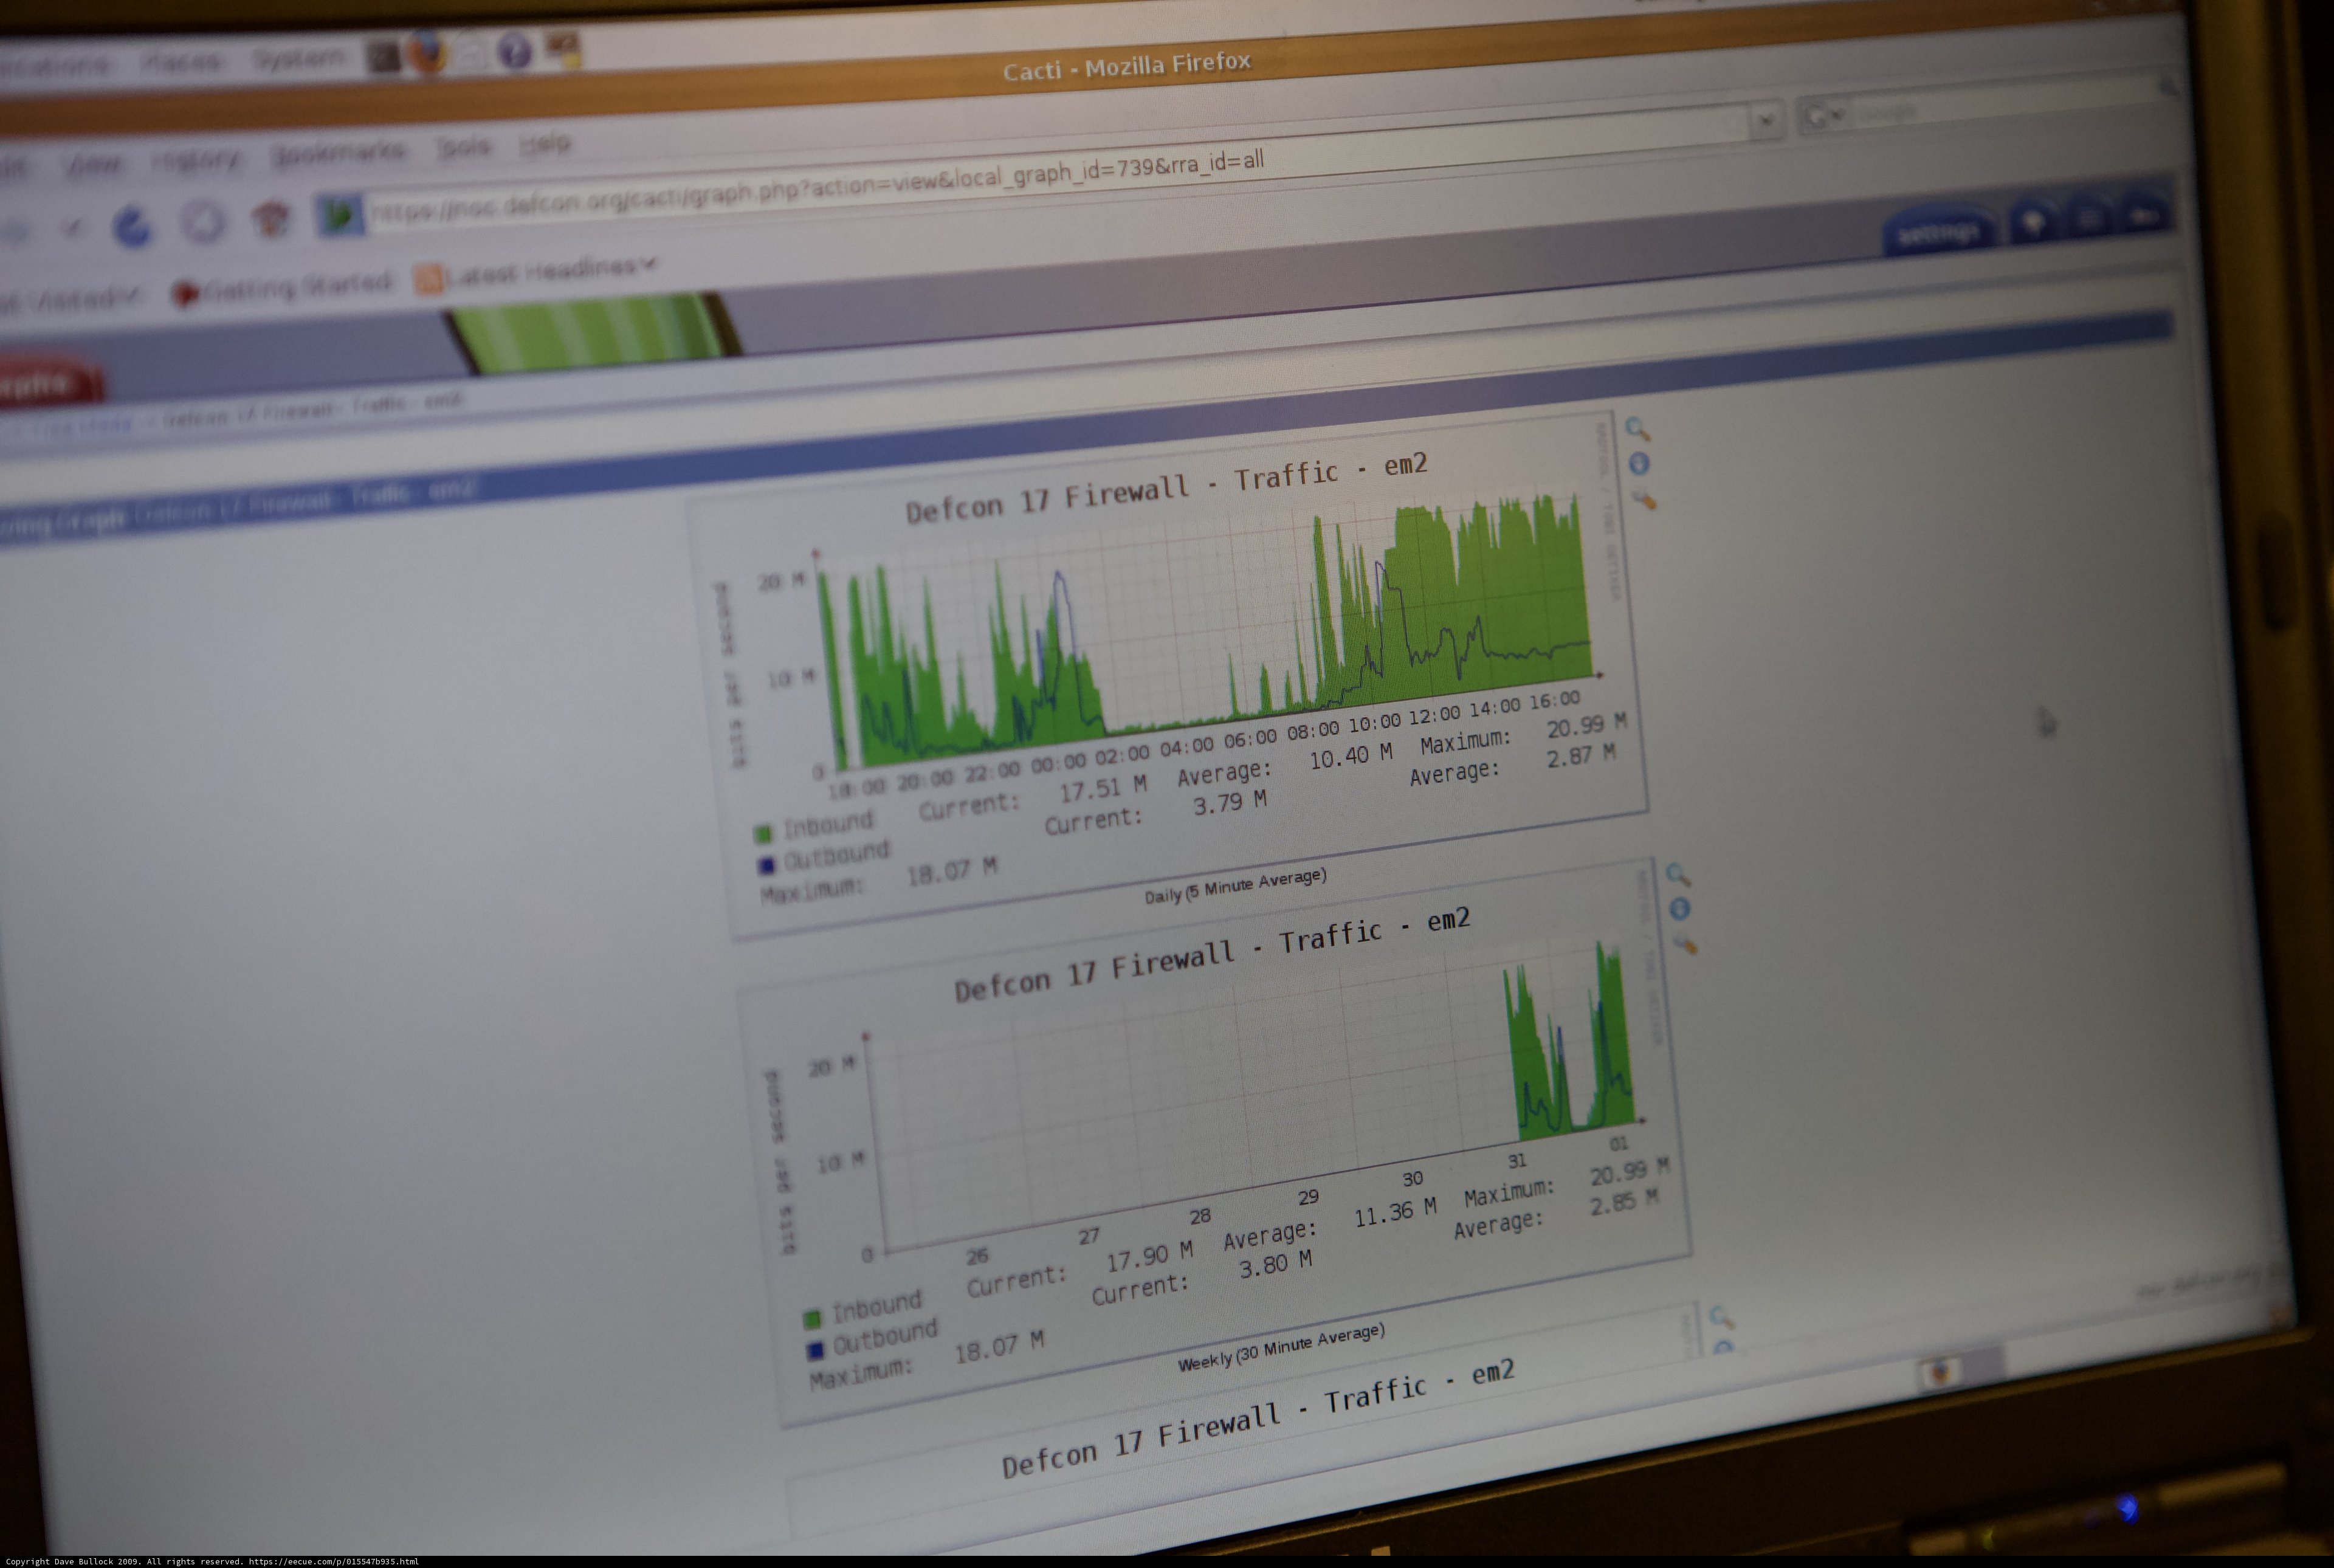
This computer screen shows a detailed chart of data analyzed at Defcon 17, a renowned hacking conference.
BLIP-2 Description:
a computer screen showing a graphChronologically Adjacent
Note: You can also navigate with your arrow keys or swiping.
Metadata
Capture date:
Original Dimensions:
5616w x 3744h - (download 4k)
Usage
Dominant Color:
outbound ii action current ml negative id mozilla maximum em eos firewall м view canon document hardware average electronics outbaund mark defcon august consumer electronics rra graph cacti inbound firefox screen apple machine text daily minute summer traffic chart monitor program computer ahp local weekly
Detected Text
iso
1600
metering mode
5
aperture
f/3.2
focal length
70mm
shutter speed
1/800s
camera make
Canon
camera model
lens model
curation
(25.00%)
highlight visibility
(1.99%)
behavioral
(10.09%)
failure
(-2.83%)
harmonious color
(-4.72%)
immersiveness
(0.20%)
interaction
(1.00%)
interesting subject
(-91.26%)
intrusive object presence
(-12.57%)
lively color
(-18.21%)
low light
(0.05%)
noise
(-4.05%)
pleasant camera tilt
(-12.19%)
pleasant composition
(-53.86%)
pleasant lighting
(-49.54%)
pleasant pattern
(1.22%)
pleasant perspective
(-3.99%)
pleasant post processing
(-0.33%)
pleasant reflection
(-4.46%)
pleasant symmetry
(0.90%)
sharply focused subject
(0.44%)
tastefully blurred
(-6.52%)
well chosen subject
(-4.71%)
well framed subject
(2.87%)
well timed shot
(-4.52%)
all
(-10.44%)
* WARNING: The title and caption of this image were generated by an AI LLM (gpt-3.5-turbo-0301
from
OpenAI)
based on a
BLIP-2 image-to-text labeling, tags,
location,
people
and album metadata from the image and are
potentially inaccurate, often hilariously so. If you'd like me to adjust anything,
just reach out.